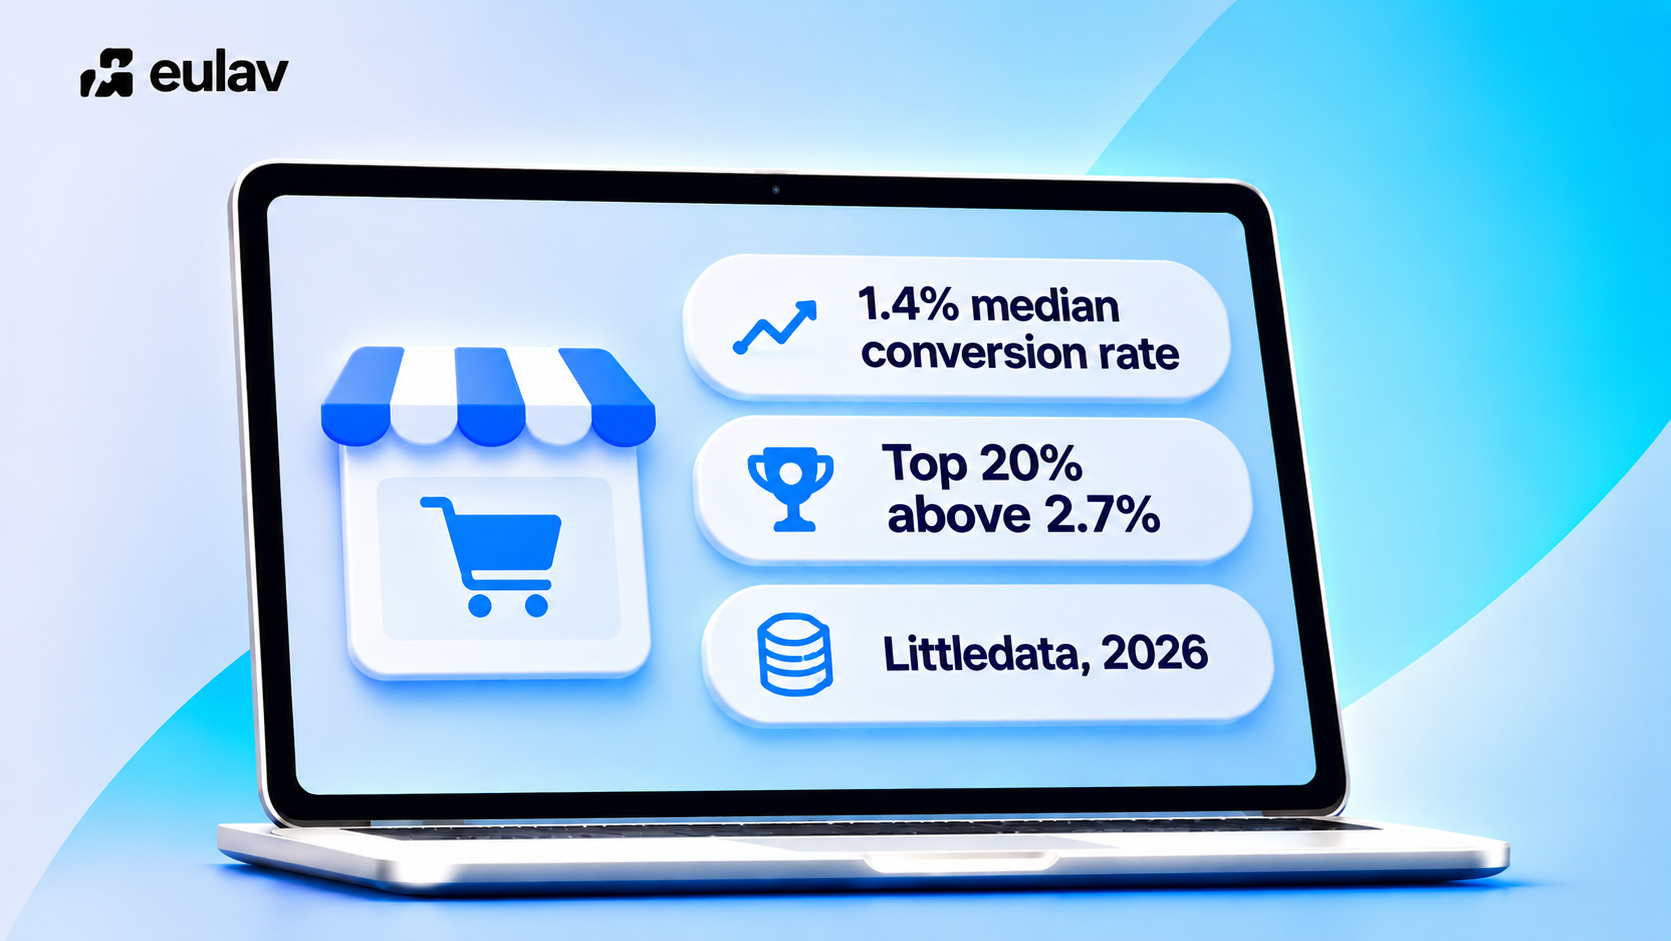
Quick answer: The average ecommerce conversion rate for Shopify stores is about 1.4% (median) and 1.9% (mean). The top 20% of stores convert above 2.7%, and the top 10% above 3.7%. If you sit between 0.5% and 2.7%, you are in the middle 60%, and your industry matters more than the overall number.
Benchmarks as of 2 November 2026, from Littledata data covering 27 July to 24 October 2026.
Average ecommerce conversion rate: the 2026 benchmarks
| Measure | Conversion rate |
|---|---|
| Median Shopify store | 1.4% |
| Mean Shopify store | 1.9% |
| Top 20% of stores | Above 2.7% |
| Top 10% of stores | Above 3.7% |
| Bottom 20% of stores | Below 0.5% |
Source: Littledata, 436 Shopify stores, share of sessions with at least one purchase (GA4).
Benchmarks by industry
| Industry | Median | Top 20% |
|---|---|---|
| Beauty and skincare | 2.5% | 3.8% |
| Health and supplements | 2.4% | 3.8% |
| Food and beverage | 2.3% | 3.3% |
| Fashion and apparel | 1.0% | 1.9% |
| Home and furniture | 1.0% | 1.8% |
Source: Littledata. Low-ticket, repeat-purchase categories convert higher. Considered purchases such as furniture convert lower, because people compare more before buying.
Mobile vs desktop
| Device | Median | Top 20% | Top 10% |
|---|---|---|---|
| Mobile | 1.5% | 3.0% | 4.2% |
| Desktop | 1.4% | 3.0% | 5.1% |
Source: Littledata. In this dataset, mobile and desktop medians are almost level. Only the very best desktop stores pull ahead.
Why you will see different numbers elsewhere
Published averages range from about 1.4% to 3%. The gap is mostly method, not truth:
- Median vs mean. A few very high converters lift the mean. The median is the better yardstick for a typical store.
- Who is measured. Some reports use only stores with paid ad data. Triple Whale reports a 2.01% median for paid traffic, based on its 2025 Ad Performance Benchmarks Report, and quotes a 2.5 to 3% Shopify average without naming a source.
- Session rules. Minimum traffic and purchase thresholds change who is included.
- Time window. Peak periods such as Black Friday raise rates.
Use one source consistently and compare against your own trend.
What is a good conversion rate for your store?
- Below 0.5%: something is blocking sales. Check page speed, product page clarity and checkout friction first.
- 0.5% to 1.4%: you are at or below the median. Most stores start here.
- 1.4% to 2.7%: solid. Gains now come from testing specific pages.
- Above 2.7%: top 20%. Protect what works and test one change at a time.
Compare yourself with your own category first, then with the overall figures.
How to measure yours
Conversion rate is the share of sessions that include at least one purchase. In Shopify, use the conversion rate on the Analytics page, and compare the same date range, device and traffic source each time. A drop in blended rate is often a traffic mix change, not a site problem. Look at paid, organic and email separately.
Where to look first for a lift
- Product pages on mobile, where most traffic lands.
- Cart and checkout steps, where shoppers drop off.
- Traffic quality: which sources send visitors who buy, and which do not.
A 1.4% store that reaches 1.9% is a 36% revenue lift from the same traffic. For the tactics, see our guide on how to improve ecommerce conversion rates and our Shopify conversion rate optimization best practices.
Turn the benchmark into a target
A benchmark only helps if it becomes a number you can chase. Here is how to do that.
1. Work out what the gap is worth. Take a store with 10,000 sessions a month. At 1.0% it takes 100 orders. At the 1.4% median it takes 140, which is 40 more orders from the same traffic. At 2.7%, the top 20% line, it takes 270. This is an illustration, so use your own sessions and average order value.
2. Aim one band up, not at the top. If you sit below the median, the next target is the median. If you sit between 1.4% and 2.7%, aim for the top 20% line. Small, believable steps get tested and shipped. A distant target gets ignored.
3. Split before you compare. Your overall rate hides the real picture. Look at it by device, by new and returning visitors, and by traffic source. A store that looks average overall often has one weak segment dragging it down.
4. Compare like with like in time. Peak periods such as Black Friday raise rates. If you are reading this in November, compare against last November, or against a quiet window, not against last month.
Three common mistakes
- Comparing your rate to the mean when the median is the fairer yardstick for a typical store.
- Comparing across industries. A 1.0% rate is ordinary in fashion and furniture, and low in beauty and supplements.
- Changing several things at once, then not knowing which one moved the number.
Write your target down, pick the one page or step most likely to close the gap, and test one change there.
Related reading
Keep going with ecommerce optimisation tools that increase sales and the best CRO tools for ecommerce.
Where Eulav fits
Move your conversion rate up from where it sits today, and see a measurable lift in your first 30 days, or get a refund. Eulav is our product, an AI-powered revenue optimisation platform for Shopify stores. It finds the opportunities on your site and runs optimisations you approve. Eulav picks and runs each optimisation, and nothing goes live without your approval. Your original site stays as it is.
Spending on traffic? Eulav is the companion to every dollar you spend on new or returning visitors, from paid ads to email, SMS and retention. At 1,000 visits, lifting conversion from 2% to 2.5% turns 20 orders into 25, with no extra ad spend.
Built for your category: Shopify CRO for fashion, beauty, supplement, jewellery, footwear brands. Comparing tools? See alternatives to Intelligems, Shoplift, Hotjar, Convert.
See what Eulav finds in your own store. Start with free opportunity finding and 2 tests.
Make the most revenue from your current channels today. Start with free opportunity finding and 2 optimisations. No card, 60-second setup.
FAQ
About 1.4% (median) to 1.9% (mean) for Shopify stores, as of October 2026.
Above 2.7% puts you in the top 20%. Above 3.7% is the top 10%.
Not in this dataset. Medians are 1.5% on mobile and 1.4% on desktop.
Different samples, medians vs means, and time windows.
Continuously. We refresh this page quarterly.
Fix the biggest blockers on product pages and checkout first, then test one change at a time.