Unlock 50%+ more revenue from your existing ecommerce traffic

AI agent audits your store, finds what’s killing sales, and shows you exactly what to fix. No guessing, no manual checking.

Join brands already unlocking 50%+ more revenue
Trusted by fast-growing brands around the world

AI That Finds Revenue Leaks. Guides You to Fix Them. Revenue Grows.

Uncover what's costing you sales

AI audits your store and catches revenue leaks — from slow checkout flows to confusing product pages. Get specific alerts on what’s killing sales, not vague suggestions.

Revvy doesn't just suggest what might work

AI identifies exact problems and tells you how to fix them. ‘Your add-to-cart button is below the fold on mobile’—not ‘improve your product page.’ You decide what to fix, when to fix it.

Revvy is built to get smarter with every interaction

AI never stops monitoring. It finds new issues as they appear and alerts you immediately. Set it up once in 60 seconds, then check insights when you want. No manual tracking required.

How Revvy Works

Three powerful features working together to grow your revenue

Complete Store Audit

Continuously scans your store and catches what’s costing you revenue the moment it happens.

Smart Strategy

Ranks issues by revenue impact—tackle what matters most first

Implementation Guidance

Shows you exactly what’s broken and how to fix it—no guesswork, just clear next step

Who Uses Revvy

Built for everyone in e-commerce – from solo store owners to agencies managing dozens of clients.

DTC Store Owners

Real-time insights from your store. See what’s killing sales and fix it – or let our team help fix it.

DTC Agencies

Whether you run ads, SEO, email, or full-service – Revvy helps your clients convert better. Add CRO to your service stack, scale it across existing clients, or refer them and earn 15% commission.

DTC Growth Teams

Stop manual monitoring and guesswork. Let Revvy find problems while your team focuses on executing high-impact tests.

Real Stores. Real Results.

See how stores are using revvy to find revenue leaks and grow sales.

Revvy vs Traditional CRO Tools

See how Revvy compares to analytics and testing tools

Feature
Google Analytics
Clarity / Hotjar / VWO
Revvy
What You Get
Data & reports
Heatmaps & A/B tests
AI insights + guidance for implementation
AI-Powered Insights
24/7 Store Monitoring
Limited
Finds Specific Problems
Tells You How to Fix
Implementation Guidance
Setup Time
Hours
1-2 hours
60 seconds
Learning Curve
Steep
Medium
Minimal
Best For
Data collection
Testing & research
Finding & fixing issues fast

Built with Compliance in Mind

Your customers trust you — and we take that seriously. Eulav Grow is built on a secure, scalable infrastructure that meets global compliance standards:

SOC 2-Ready Infrastructure.

Enterprise-grade security at every level.

GDPR Compliant.

We respect EU & UK user privacy rights

CCPA Compliant.

Transparent data handling aligned with California law and adaptable to evolving U.S. privacy regulations.

PIPEDA Compliant.

Data protection aligned with Canadian law. Revvy handles optimization — you stay compliant, everywhere.

Works for Any Ecommerce Store, On Any Platform

Whether you’re on Shopify, WooCommerce, Magento or custom — Eulav Grow plugs in seamlessly and starts learning from day one.

Exclusive Slack community for Revvy users

Join Revenue Lab by Eulav

Turn AI recommendations into revenue faster with direct implementation support from our team.

Frequently Asked Questions

You'll identify your first conversion issues within 2 minutes of setup. Implementation timeline depends on you - some fixes take minutes (moving a CTA), others might need dev help (checkout flow changes). Stores typically see measurable conversion improvements within 30-45 days of fixing what revvy finds.

revvy connects to your existing tools and works alongside them. GA4 shows you WHERE people drop off. revvy tells you WHY and HOW to fix it. Instead of 'checkout has 70% drop-off,' you get 'your CTA button is below the fold on mobile—move it 200px up.' Think of it as the diagnostic layer your analytics is missing.

Yes. revvy works with Shopify, WooCommerce, BigCommerce, Magento, and custom platforms. Setup takes 60 seconds - just add a code snippet or install our plugin.

Absolutely. We're SOC 2 compliant, GDPR compliant, and built on enterprise-grade infrastructure. We monitor your store's performance - we never access customer payment info, passwords, or personal data. Your data stays yours

No. revvy explains issues in plain language ('Your add-to-cart button is invisible on iPhone 12') and shows exactly what to fix. If you can use Shopify, you can use revvy. Need help implementing fixes? Our team can handle that at an additional fee.

Pay-as-you-go with Revs. Use what you need, when you need it. No contracts, no monthly subscriptions.

Start Growing Revenue Today

Let Revvy get to work finding revenue opportunities

Exclusive Slack community for Revvy users

Join Revenue Lab by Eulav

Turn AI recommendations into revenue faster with direct implementation support from our team.

Get more value from Revvy
Trusted by stores in US, UK, Canada.
Approval required. Open to Revvy customers.

How a Data-Backed Strategy Led to a 185% Revenue Surge for Australian Cacao

By: Eulav

Customer Name

Australian Ceremonial Cacao

Customer Industry

Premium Health & Wellness (Ceremonial Cacao)

Customer Goal

Scale revenue from existing organic traffic

Services

CRO & Strategic Execution

Results

185% increase in total revenue within 30 days

Conversion ceiling unlocked

CVR up to
7.63% from a 1.46% baseline

Funnel friction removed

Add-to-cart rate up to
10.4%

Business impact

+185% revenue in 30 days

driven primarily by organic and existing traffic

Australian Cacao: How a 1,000-Session Store Grew Revenue 185% Without Additional Traffic

Australian Cacao sells ceremonial-grade cacao to a niche, intent-driven audience. At the time of engagement, the store was receiving approximately 1,000 organic sessions per month, with a loyal returning customer base but a measurably poor new visitor conversion rate.

The problem was not traffic volume. It was funnel efficiency.

The Struggle: The "Small Traffic"

In the world of Conversion Rate Optimization (CRO), most experts will tell you that 1,000 sessions a month isn’t enough traffic to test. They’ll say you need to wait months to get enough data to make a move.

Ice Inkhamwong didn’t have months to wait. She knew the traffic was high-quality, but the website felt like a “leaky bucket.” She was stuck in a paradox: she needed more revenue to justify an ad spend, but she couldn’t get more revenue because the site wasn’t converting the traffic she already had.

The core issues were invisible to the naked eye:

  • Technical Debt: The site felt “heavy.”
  • Insider Language: The content was written for people who already understood ceremonial cacao, leaving newcomers feeling like they didn’t belong.
  • Friction at the Finish Line: The Product Detail Page (PDP) wasn’t guiding users toward a purchase.

The Diagnosis: Revvy

The store presented three distinct friction categories identifiable through behavioral and technical data.

First, a 26MB hero image on the homepage created critical load latency for mobile users. Most were exiting before the page rendered. This is not a design problem. It is a technical one with a direct, calculable impact on bounce rate and session depth.

Second, the site’s copy was written for an audience already familiar with ceremonial cacao. New visitors, arriving through organic search with exploratory intent, encountered language that assumed prior knowledge. The result was a high exit rate among the exact demographic the brand needed to convert.

Third, the product detail page lacked purchase-decision architecture. There was no clear reason-to-buy framing for a first-time visitor comparing Australian Cacao against lower-priced alternatives.

The Audit

Revvy found strategic gaps that were costing her hundreds of dollars.

Rather than a manual audit process spanning several weeks, the store was run through Revvy. By connecting Google Analytics and Microsoft Clarity, Revvy extracted behavioral patterns, audience data, and positioning gaps within the first session. The AI findings were refined by our team into an execution roadmap by day four.

1. The Large files

The most shocking technical discovery? The hero image on the homepage was 26 megabytes. For a mobile user on a standard connection, the page took ages to load. Most users were bouncing before they even saw the product.

2. The "Insider" Bias

Revvy identified that the brand positioning was confusing for “seekers” – who wanted to try ceremonial cacao. The content favored those who already knew exactly what they wanted, creating a wall for new organic users.

3. PDP Experience

The product pages lacked a clear “Reason to Buy.” There was no motivation for a first-time visitor to choose Australian Cacao over a cheaper alternative.

Intervention

Three changes were made, in parallel, without a staged A/B testing window.

Image compression and script error resolution brought load times into an acceptable range for mobile users on standard connections.

The copy and page layout were restructured to address a dual audience: returning customers familiar with the ritual, and new visitors still in the consideration phase. Both segments needed to find relevance on the same page.

The product detail page was reorganized around purchase decision logic: product integrity, differentiation, and a clear call to action in the correct hierarchy.

Reaping the Rewards: Same Traffic, New Scale

By week two, click-through rates and add-to-cart actions had increased 60% . Revenue was up 40% against the pre-intervention baseline.

By week three, weekly revenue had increased 145% against the same baseline.

By end of month, total revenue had grown 185% on identical traffic volume.

The growth was not driven by new sessions. It was driven by removing the conditions that were preventing existing sessions from converting.

Ready to unlock the revenue hidden in your existing traffic?

How Calmerceuticals Achieved a 203% Conversion Lift for "Ultra Performance"

By: Eulav

Customer Name

Calmerceuticals

Customer Industry

Premium Science-Led Wellness

Customer Goal

Launch the "Ultra Performance" line with high-converting, premium-design PDPs.

Services

CRO & Strategic Execution

+203%

Sales lift for Women’s 14-Sachet

+78%

Sales lift for Women’s 28-Sachet

Overview: A Brand Ready to Launch

Calmerceuticals entered the engagement with a 4.2% conversion rate and an established customer base. The immediate objective was the launch of the Ultra Performance line for men and women. The requirement was not aesthetic execution alone. It was page architecture that could carry both premium brand positioning and the evidence-based credibility that supplement buyers at this price point require before committing to a purchase.

The Baseline

Before any design work began, existing analytics were integrated into Revvy to establish a behavioral baseline independent of assumption.

Two patterns emerged from the data.

Mobile sessions accounted for 82% of total traffic. Despite this, the content architecture required significant vertical scrolling before a visitor could extract core product meaning or value differentiation. Comprehension was being delayed by layout, not by product complexity.

Scroll-depth analysis showed that 68% of users reached the ingredient information section. Only 25% progressed to the content that explained experiential product outcomes. The information visitors needed to make a purchase decision was positioned after the point where most of them had already stopped engaging.

Behavioral Findings

We integrated Microsoft Clarity and GA4 into Revvy, and user interaction patterns were evaluated through behavioral intent modeling.

Two dominant patterns emerged:

1. Mobile Dominance

Mobile sessions accounted for 82% of total traffic. Despite this, content architecture required excessive vertical scanning before users could extract core product meaning or value differentiation. This increased interaction friction and reduced early comprehension efficiency.

2. Delayed Value Communication

Scroll-depth analysis demonstrated that 68% of users reached the ingredient information section, whereas only 25% progressed to expectation-setting content that explained experiential product outcomes. This indicated that interpretive product meaning was introduced too late in the engagement sequence.

The Intervention: Meaning Before Detail

Revvy’s behavioral data indicated that the product detail pages were structured as informational repositories rather than persuasion sequences. The content was present. The order was wrong.

The Ultra Performance product pages were restructured around a single sequencing principle: expectation before explanation before proof. Experiential outcomes were positioned first, technical specification second. This ordering activates intuitive evaluation before logical justification, which is consistent with how purchase decisions are actually made, particularly on mobile where attention windows are compressed.

Expectation → Explanation → Proof

This structure repositioned experiential meaning (anticipated user outcomes) before technical specification details. The redesign aligns with dual-process decision theory, activating intuitive emotional evaluation prior to logical purchase justification. This sequence reduced cognitive friction and increased purchase readiness.

The Outcomes

Results were recorded against the pre-launch baseline.

Women’s Ultra Performance line: the 14-sachet variant recorded a 203% increase in sales. The 28-sachet variant recorded a 78% increase.

Men’s Ultra Performance line: the 14-sachet variant recorded a 33% increase in sales.

The source material ends mid-sentence. If you have the closing line, share it and I will complete the final paragraph.

The Women’s Ultra Performance Line:

  • +203% increase in sales for the 14-sachet variant.
  • +78% increase for the 28-sachet variant.

The Men’s Ultra Performance Line:

  • +33% increase in sales for the 14-sachet variant.

The data proved that when you provide meaning before detail and remove cognitive friction, you

Ready to unlock the revenue hidden in your existing traffic?

How Bailey & Coco Lifted Conversions by 28.9% Through Trust Architecture

By: Eulav

Customer Name

Bailey & Coco

Customer Industry

Premium Pet Accessories (UK)

Customer Goal

Refine site flow and lift conversion rates without losing the brand's emotional, premium feel

Services

Audit & Strategic execution

Conversion Rate lift

+28.9%

Cart-to-Checkout improvement

+12.7%

Overview

Andrew, the founder of Bailey & Coco, had built one of the UK’s most recognised premium dog brands. At the time of engagement, traffic acquisition was healthy and the add-to-cart rate among product viewers sat at 74% , confirming strong product desirability. The conversion rate was 3.05% . The gap was not in demand. It was in what happened between cart engagement and checkout initiation.

The Diagnosis

Revvy identified three primary friction categories.

Pop-ups and data capture forms were triggering before visitors had adequate exposure to the brand or product value. The interruption was occurring at the wrong point in the decision sequence, before trust was established, not after.

Menu density was creating navigation disorientation. A 25% quick-back rate indicated that visitors were entering the navigation structure and exiting without completing a meaningful path.

Over 380 JavaScript errors and multiple non-responsive click elements were detected across the site. Individually, each failure was subtle. Collectively, they degraded perceived site reliability at a brand positioning that required the opposite signal.

Three secondary friction points compounded the primary issues.

Approximately 80% of sessions originated from mobile. The primary add-to-cart element was positioned below the initial viewport on mobile, requiring scroll before the visitor could take action. Most did not scroll to that point.

Heatmap data showed the majority of visitors engaging only with the top 25% of homepage content. Trust elements including the Comfort Guarantee were positioned beyond typical scroll depth and were therefore not influencing purchase decisions.

The product page communicated brand authority and premium positioning. The cart environment shifted to functional, transactional language. That tonal inconsistency introduced a measurable erosion of decision confidence at the point of purchase commitment.

  • Premature Cognitive Interruptions

    Pop-ups and data capture forms were triggered before visitors had sufficient exposure to the brand narrative or product value. This introduced distraction and reduced initial engagement depth.
  • Navigation Load and Decision Friction

    Overly dense menu structures increased cognitive processing demands, resulting in elevated quick-back behavior (25%)  and navigation disorientation.
  • Technical Performance Instability
    More than 380 JavaScript errors and multiple instances of non-responsive click elements were detected. While individually subtle, these failures collectively reduced perceived site reliability and weakened the premium brand perception.

The analysis also revealed consistent micro-hesitation patterns that cumulatively reduced conversion progression:

  • Mobile Interaction Friction

    Approximately 80% of traffic originated from mobile devices. However, the primary Add-to-Cart interaction point was frequently positioned below the initial viewport, requiring excessive scrolling before actionable engagement and most do not scroll up to that point.
  • Scroll Depth Suppression

    Session heatmap data demonstrated that most visitors engaged only with the top 25% of homepage content. High-value reassurance elements, including the Comfort Guarantee, were positioned beyond typical engagement depth and therefore failed to influence early decision confidence.
  • Trust Continuity Breakdown

    A tonal and structural transition occurred between the product page and cart environment. The product page communicated premium care and brand authority, whereas the cart experience shifted toward functional, transaction-focused messaging. This inconsistency introduced a subtle but measurable erosion of decision confidence at the purchase commitment stage.

The Interventions

Four changes were implemented in the first phase.

A four-element trust row was added to the homepage and product pages, placing safety and comfort indicators above the fold rather than below typical engagement depth.

Pop-up triggers were delayed to 30 seconds or exit-intent only, allowing the brand narrative to load before requesting data capture.

Cart messaging was revised to maintain the emotional register established on the product page, keeping tone consistent across the purchase transition.

A sticky add-to-cart element was implemented on mobile, ensuring the purchase action was accessible at any scroll depth without requiring the visitor to locate it.

  • Reassurance Rows: We added a 4-icon trust row to the homepage and product pages, bringing “Safety” and “Comfort” benefits above the fold.
  • Delayed Popups: We pushed pop-ups to 30 seconds or exit-intent only, letting the brand breathe before asking for an email.
  • Cart nudges: We replaced standard cart text with emotional affirmations (“Almost ready for your next walk”).
  • Sticky Accessibility: We implemented a sticky “Add to Cart” on mobile to ensure the path to purchase was always one thumb-press away.

The Outcomes

Results were measured over a 14-day window in the post-Black Friday period, a window typically associated with conversion rate decline across most ecommerce stores.

Conversion rate moved from 3.05% to 3.93%, a 28.9% increase.

Cart-to-checkout rate improved by 12.7%.

Mobile search conversion rate improved by 46.7%.

The gains were generated on the same traffic volume. The variable was not audience size. It was the number of visitors who reached checkout with sufficient confidence to complete the purchase.

The Numbers (Shopify Analytics):

  • Conversion Rate: Jumped from 3.05% to 3.93% (+28.9%).
  • Cart-to-Checkout: Improved by 12.7%. This was our biggest win—it proved that the “Trust Architecture” was keeping users confident enough to proceed.
  • Mobile Search CVR: Saw an exceptional 46.7% improvement.

We proved our hypothesis: We didn’t need to find new people interested in the products; we just needed to change how many of them felt confident enough to complete the journey.

Ready to unlock the revenue hidden in your existing traffic?

How a Data-Backed Strategy Drove a 130%+ Revenue Surge for 8000Kicks

Prepared by: Eulav | June 7, 2026B

Customer Name

8000Kicks

Customer Industry

Sustainable Footwear — World's First Hemp Shoes

Customer Goal

Conversion Rate Optimization (CRO) & Strategic Execution

Services

+133% CVR improvement. +130%+ revenue growth on identical traffic volume.

METRIC

PRE-INTERVENTION (FEB–MAR 2026)

POST-INTERVENTION (APR–JUN 2026)

CHANGE

CVR

0.69%

1.61%

+133%

Conversion Ceiling Unlocked

METRIC

PRE-INTERVENTION (FEB–MAR 2026)

POST-INTERVENTION (APR–JUN 2026)

CHANGE

Add-to-Cart Rate

1.94%

4.19%

+116%

Reached Checkout

~1.5%

4.16%

+177%

AOV

~$139

$147.31

+6%

Men’s Collection CVR

0.60%

1.41%

+135%

Funnel Friction Removed

UX METRIC

PRE-INTERVENTION

POST-INTERVENTION 

CHANGE

JS Errors

4.34% (6,952 errors)

0.67% (116 errors)

-80.3%

Dead Clicks

2.59%

0.35%

-86.5%

Rage Clicks

Active

0 (eliminated)

Eliminated

Quick Backs

1.89%

0.49%

-74%

Performance Score

81/100

89/100

+10%

LCP

2.6s

2.2s

-15.4%

The Diagnosis

Based on behavioral and technical data from Shopify, Google Analytics, and Microsoft Clarity, Revvy identified three distinct friction categories silently draining revenue from 8000Kicks’ existing traffic:

  1. JavaScript Errors Breaking the Purchase Path
    A 4.34% JS error rate affected roughly 1 in 23 sessions. The dominant error — cannot read properties of undefined (reading ‘value’) — was silently breaking the add-to-cart and checkout flow. Visitors attempting to purchase were hitting invisible walls, and the store had no visibility into how many sales they were losing.

  2. Mobile Performance Penalty
    A 26MB hero image on the homepage created significant load latency for mobile users — who made up 68% of traffic. Combined with render-blocking scripts and unoptimized font loading, the Largest Contentful Paint (LCP) sat at 2.6–2.8 seconds, pushing the performance score to a fragile 81/100. Mobile visitors were bouncing before the page finished loading.

  3. Collections Pages Not Built for Conversion
    The collections pages treated all visitors equally — returning customers who already knew the brand and first-time visitors who needed convincing. No social proof, no trust reinforcement, and no purchase decision architecture. The men’s hemp shoes collection was converting at just 0.60%, leaving 994 out of every 1,000 visitors unconverted.

The Audit

Revvy performed a full diagnostic by connecting Google Analytics and Microsoft Clarity to 8000Kicks’ Shopify store, producing an execution roadmap within four days. The audit uncovered:

  • Technical debt silently blocking transactions
  • Page-level conversion gaps across the homepage, collections, and PDP
  • Performance bottlenecks disproportionately affecting the mobile majority
  • UX friction patterns — dead clicks, rage clicks, and quick backs — revealing exactly where visitors were getting confused or frustrated

The roadmap was sequenced across three sprints, prioritized by impact and implementation ease

The Intervention

Sprint 1: Technical Foundation & Trust Architecture (April 1–24, 2026)

CHANGE

WHAT WAS DONE

WHY

JS Error Remediation

Fixed cannot read properties of undefined errors in cart and ATC handlers

Errors were silently killing 4.34% of all sessions — an estimated 1 in 23 visitors couldn’t complete their purchase

Performance Optimization

Image compression, font preloading, render-blocking script deferral

Mobile load times directly correlate with bounce rate and conversion at 8000Kicks’ traffic composition (68% mobile)

Monica Trust Bar (Smart Cart A/B Test)

Replaced generic “Free Socks” prompt with a 3-icon trust bar in the cart drawer

Tested whether trust reinforcement at the cart stage would improve progression to checkout

Homepage Slide Fixes

Corrected outdated terminology and optimized hero image loading

Corrected outdated terminology and optimized hero image loading

Sprint 2: Product Detail Page Restructure (April 16, 2026)

CHANGE

WHAT WAS DONE

WHY

Sticky Add-to-Cart

Fixed cannot read properties of undefined errors in cart and ATC handlers

Errors were silently killing 4.34% of all sessions — an estimated 1 in 23 visitors couldn’t complete their purchase

Inline Shipping Callout

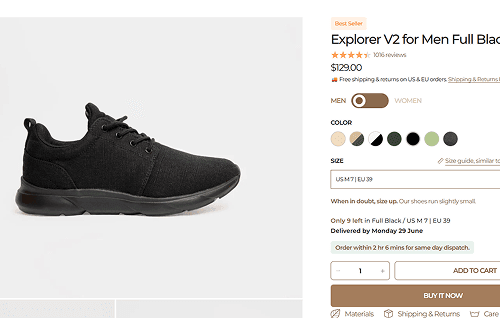
Free shipping & returns messaging placed directly beside the price

$129 price point requires immediate value reassurance

Prominent Reviews

Star rating and review count moved above the fold

Social proof at the moment of purchase consideration

Decluttered Above-Fold

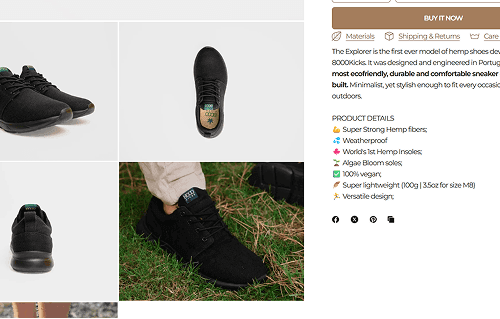
Removed non-essential elements from the purchase decision zone

Every pixel above the fold now serves conversion

Sprint 3: Collections & Homepage Redesign (May 23, 2026)

CHANGE

WHAT WAS DONE

WHY

Collections Page Restructure

Applied purchase-decision architecture — social proof mid-page, benefit-led copy, trust reinforcement, clear product hierarchy

The men’s collection was converting at 0.60% — visitors were browsing but not buying

Homepage Redesign

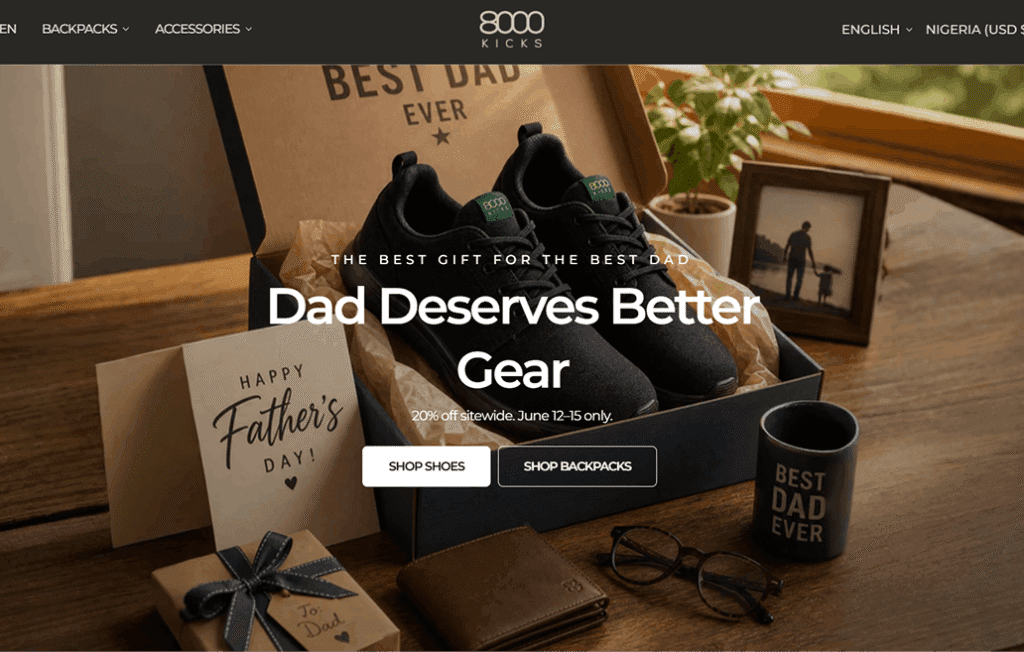
Restructured hero, updated messaging, optimized for both new and returning visitors

Homepage was the top landing page (1,940+sessions/week) but not efficiently routing to purchase

Technical Audit

Full site-wide JS error pass, performance score pushed from 82 → 89, LCP under 2.5s threshold

Residual errors and performance gaps from Sprint 1 were addressed comprehensively

Reaping the Rewards: Same Traffic, New Scale

By Week Two (April 10–24, 2026)

Click-through rates and add-to-cart actions had increased by 116%. Revenue was up over 130% compared to the pre-intervention baseline. The Monica cart trust bar test showed a +12.1% revenue-per-user lift — a confirmed winner.

By Week Four (May 2026)

The conversion rate had stabilized above 1.6% — more than double the 0.69% baseline. AOV climbed to $147.31 (+6%). Returning customer rate reached 31.93%, signaling that the improved experience was generating not just more buyers — but more loyal ones.

By End of Period (June 2026)

The redesigned men’s collection page alone showed a 135% CVR improvement (0.60% → 1.41%), with revenue growing 59% despite 8% fewer landing sessions — traffic was being cannibalized by an unoptimized deals page that was later flagged for redesign. UX friction across the site had collapsed: JS errors down 80%, dead clicks down 86%, rage clicks eliminated entirely, and quick backs down 74%. Performance score reached 89/100 with LCP at 2.2s — crossing the “good” threshold.

This growth was not driven by new traffic. It was driven by removing the conditions that prevented existing traffic from converting.


Business Impact

**+130%+ revenue growth on identical traffic volume across the April–June 2026 period.**

The 8000Kicks case demonstrates that when a store with loyal customers and strong products is held back by technical friction and conversion architecture gaps, the fastest path to revenue growth is not more traffic — it’s fixing what’s already broken

AREA

RESULT

Overall CVR

0.69% → 1.61% (+133%)

Add-to-Cart Rate

1.94% → 4.19% (+116%)

Men’s Collection CVR

0.60% → 1.41% (+135%)

JS Errors

4.34% → 0.67% (-80.3%)

Dead Clicks

2.59% → 0.35% (-86.5%)

Rage Clicks

Eliminated

Performance Score

81 → 89/100

LCP

2.6s → 2.2s

AOV

~$139 → $147.31

Data sources: Shopify (ground truth for sessions, orders, revenue, CVR), Microsoft Clarity (ground truth for UX behavior, JS errors, performance), Smart Cart A/B test platform. Period: February 21 – June 7, 2026. Pre-intervention baseline: Feb 21 – Mar 23, 2026. Primary measurement: April 1 – June 7, 2026.

Want to see what Revvy finds in your data?

Become an Affiliate

Ask us Anything

Happy to help with urgent optimization needs

Grow Store Revenue . Get Early Access.

Join the growing list of ecommerce brands getting early access.

We’re waiting on the other side of this form for your message

We’re waiting on the other side of this form for your message

We’re waiting on the other side of this form for your message